Network Flow Stabilization meets Physical Load Optimization
ProvisionAi is truckload optimization and transportation planning software that helps prevent OTIF failures, maximizes payload on every truck, and ends carrier rejection — without replacing your TMS, WMS, or APS.


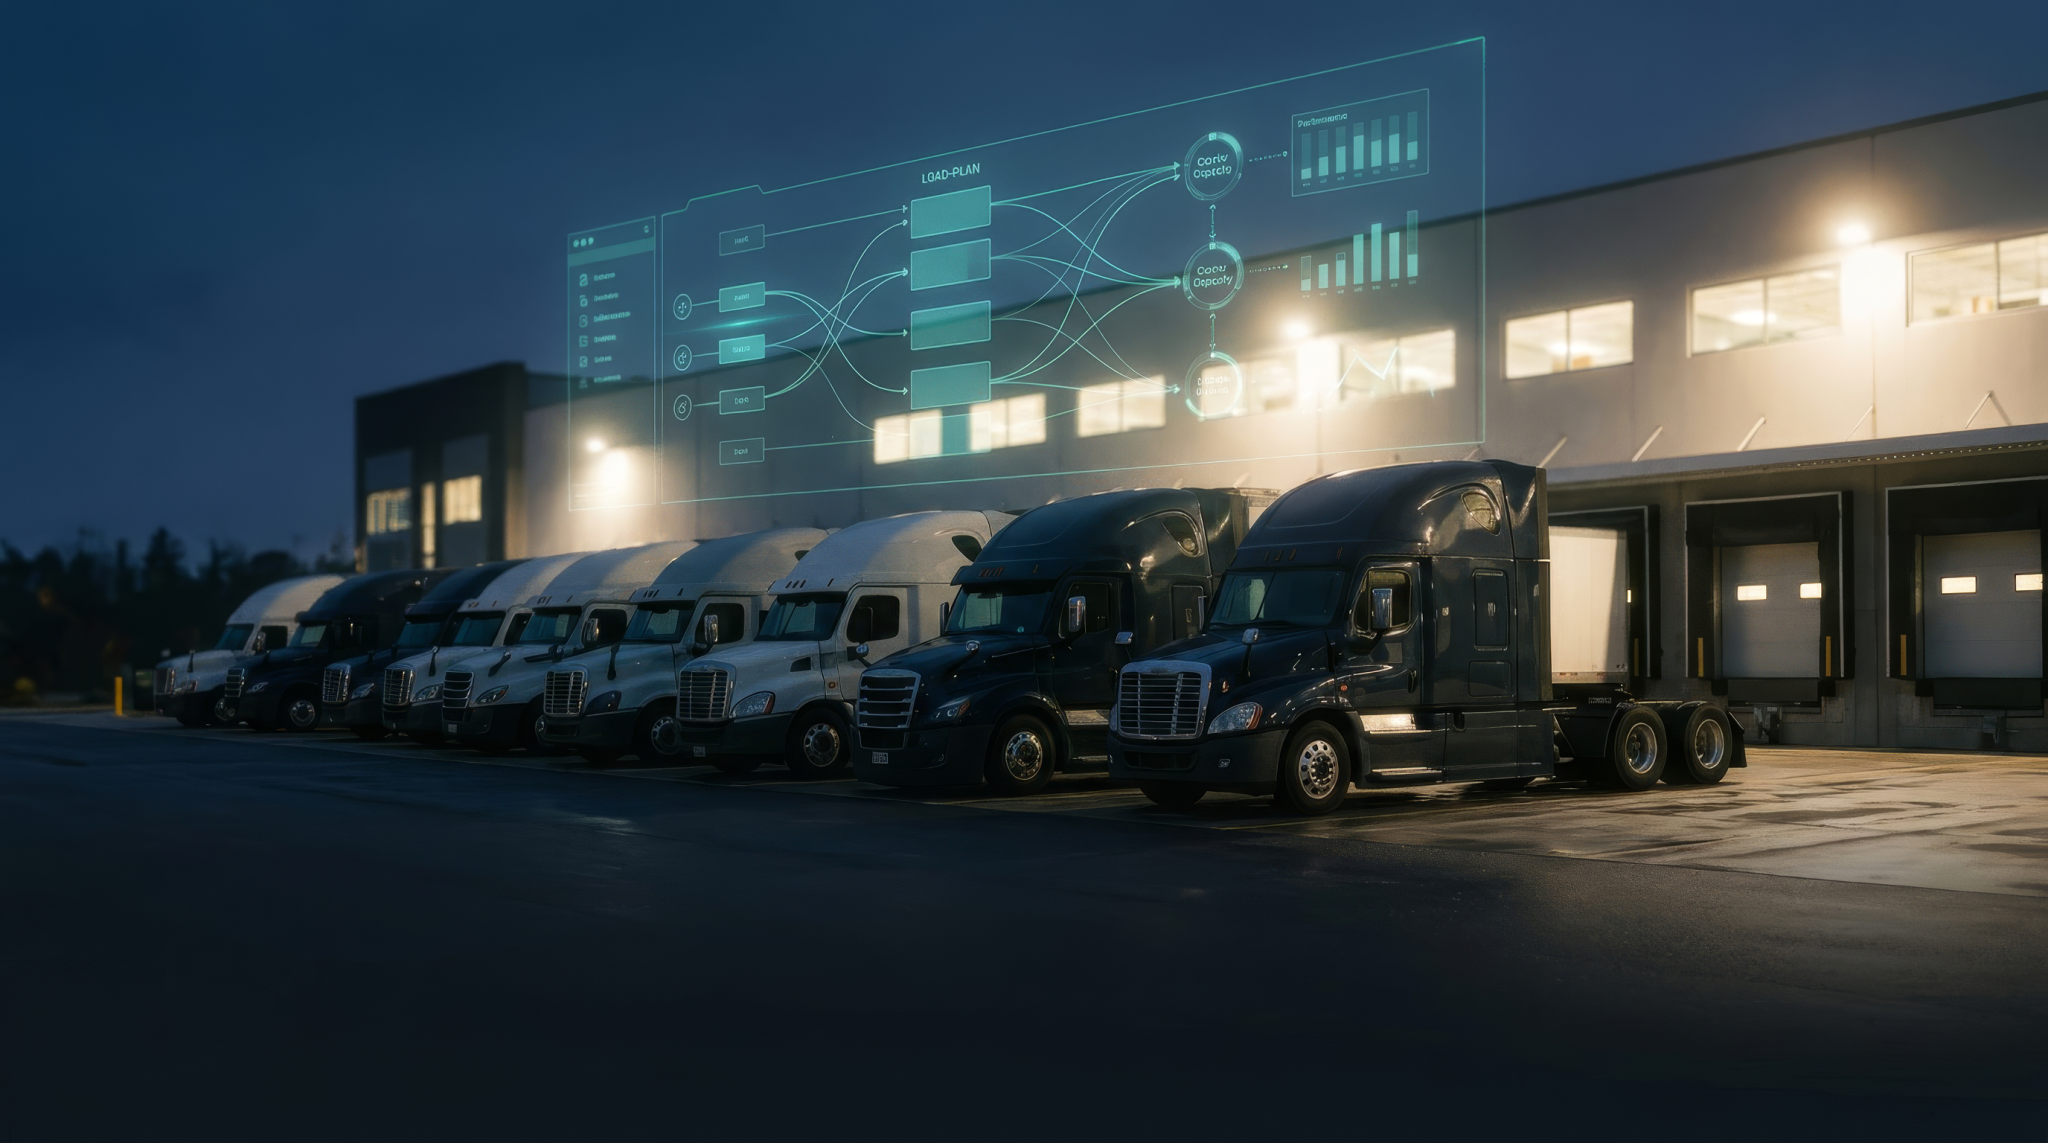
AutoO2 for truckload building. LevelLoad for supply network planning. Each stands alone. Together they eliminate OTIF failures, reduce Scope 3 emissions, and cut freight costs 5–10%.

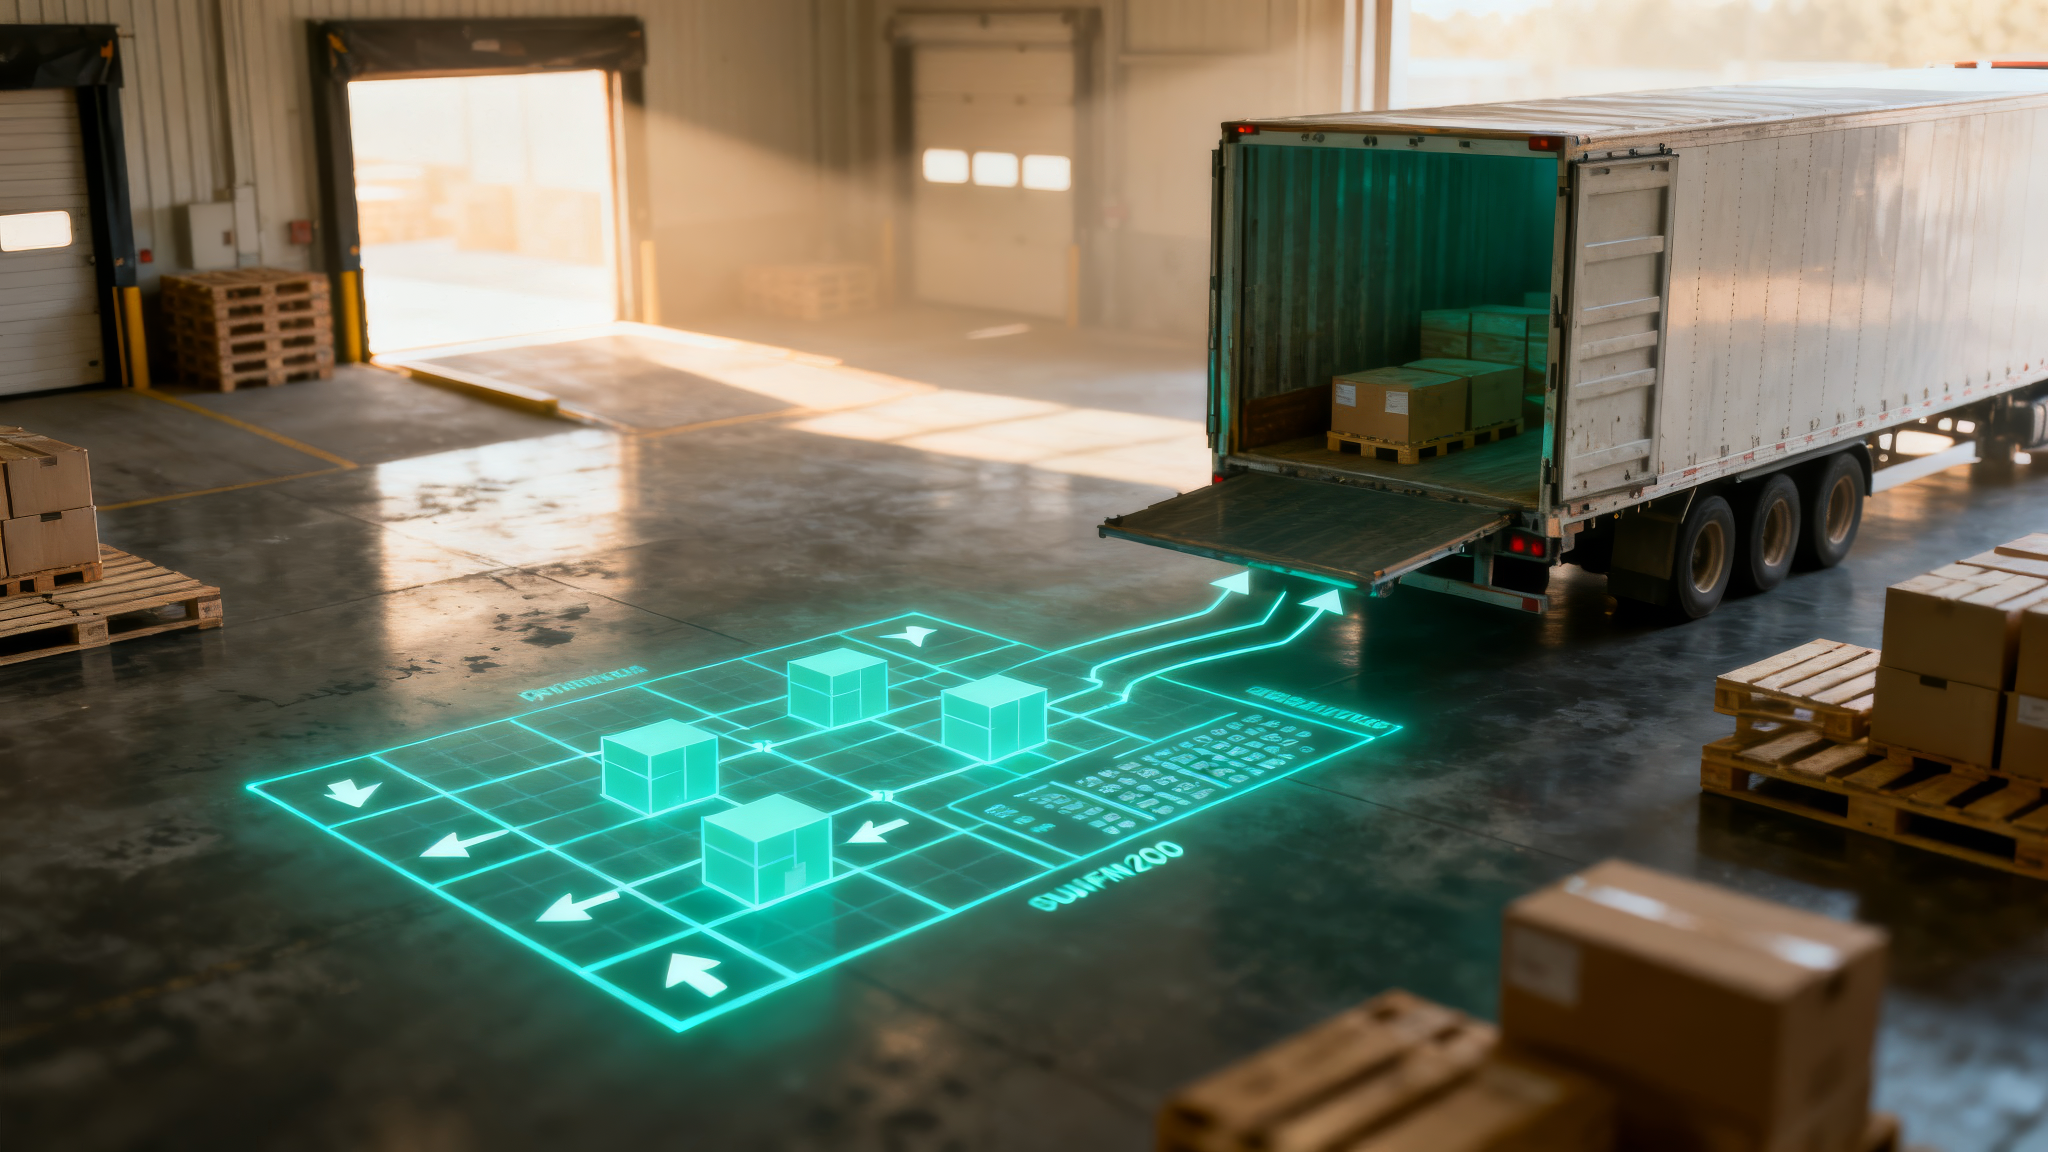
Mathematical truckload optimization across 300+ constraints — axle weight, cube, stacking, damage prevention. Connected to your WMS. 5–10% freight cost reduction. 90-day ROI.
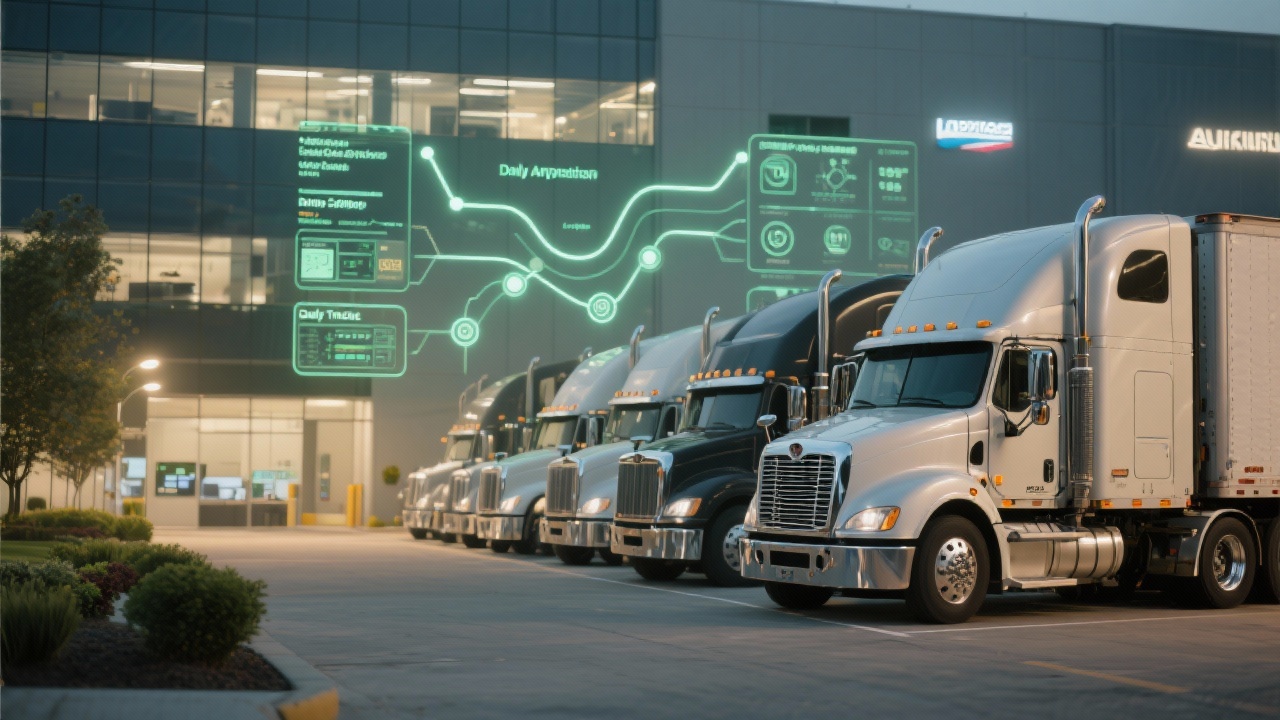
Patented supply network planning that smooths replenishment volumes 30 days ahead. Level loading transportation at scale — carrier capacity reserved before the spike, OTIF supply chain failures fixed at the source. 97% first tender acceptance. 60% variability reduction.
In their words

"Reduced variability daily by 60% across all North American operations."
~4% replenishment freight savings · ROI within 4 months
"AutoO2 gave our team a repeatable process — anyone can build an optimized load on day one."
5–10% freight cost reduction · ROI within 90 days
"The global best practice for case picking and truck loading."
5–10% freight cost reduction · ROI within 90 days
Rate yourself across four domains — load optimization, network flow, OTIF performance, and system integration. Your scores build a prioritized roadmap, ranked by where you're losing the most. Takes 15 minutes. No account required to start.
Start the Assessment → Free · 15 minutes · No account required
Common Questions
ProvisionAi provides two patented supply chain software products — AutoO2 and LevelLoad — that address the two largest sources of transportation cost and OTIF failure in high-volume replenishment operations. AutoO2 is load building software that uses mathematical optimization to maximize legal payload on every truck, solving 300+ constraints including axle weight limits, cube utilization, stacking rules, and damage prevention. LevelLoad is a transportation planning and transportation smoothing system — a digital twin of the supply chain network — that builds a 30-day, capacity-constrained deployment schedule across every lane, stabilizing replenishment volumes, eliminating carrier rejection, and reducing Scope 3 transportation emissions.
Together, AutoO2 and LevelLoad close the gap between supply network planning and physical execution — the gap that standard TMS, WMS, and APS systems cannot see. ProvisionAi serves CPG, food and beverage, and industrial manufacturers shipping 5,000+ truckloads per year across North America, EMEA, and Asia-Pacific. Clients include Kimberly-Clark, Nestlé, Campbell's, Duracell, Diageo, Riviana Foods, and Baxter.
When you visit any website it may store or retrieve information on your browser, mostly in the form of cookies. This information might be about you, your preferences or your device. You can choose not to allow some types of cookies. Click on the different category headings to find out more and change your default settings.
These cookies are required for the website to function and cannot be disabled.
These cookies remember your preferences (language, region, etc.) to personalise your experience.
These cookies help us understand how visitors interact with the website by collecting information anonymously.
These cookies track your activity to deliver personalised advertisements.

